| |
 |
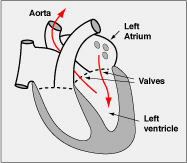
In contrast to many modern industrial pumps, the heart works not as a flow-pump ( Problem 12) but intermittently. It takes up blood from the left (or right) atrium into the left (or right) ventricle, closes all the valves, contracts, and increases the pressure of the fluids. Then the blood is ejected, for example from the left ventricle into the aorta from where it flows through the body. Problem 12) but intermittently. It takes up blood from the left (or right) atrium into the left (or right) ventricle, closes all the valves, contracts, and increases the pressure of the fluids. Then the blood is ejected, for example from the left ventricle into the aorta from where it flows through the body.
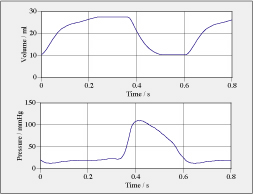
Data is given in graphical form for the volume of blood and the pressure of blood in the left ventricle for (a little more than) a cardiac cycle of a sheep (see diagram; data is given in tabular form in PV_Sheep_Ventricle. ). Pressure is from measurements, volume is from a dynamical model.
-
Use the time graphs of volume and pressure to describe how the left ventricle works.
-
Create a so-called pV diagram (pressure - volume diagram) for the left ventricle (plot the pressure as a function of volume). Use this diagram to interpret the function of the left ventricle. Note that there are four distinct phases in the operation of the heart.
-
Determine the stroke volume (the volume of blood ejected during one cycle). Show the quantitiy in the pV-diagram.
-
In the pV-diagram ( PV_Loop), identify the end-diastolic pV-relation (slope of the pV curve during filling of ventricle) and the end-systolic pV-relation (maximum slope …
|
|
at the end of ejection of blood). Calculate the elastances of the heart for these phases (see Internet Link).
Click HERE to obtain pdf
|